Let’s consider a large number of different possible centering techniques, both at level 1 and level 2 and see how they impact the interpretation of the intercept and slopes. Say that we have an outcome variable called "read" and a predictor called "iq" and we have the data at 2 levels, at the student level (level 1) and the school level (level 2), We have 3 schools with 4 students within each school.
If we ran a separate regression predicting "read" from "iq" for each school, we would find that this slope would be about 1 within each school. This represents the within school relationship between "read" and "iq" and is graphed below.
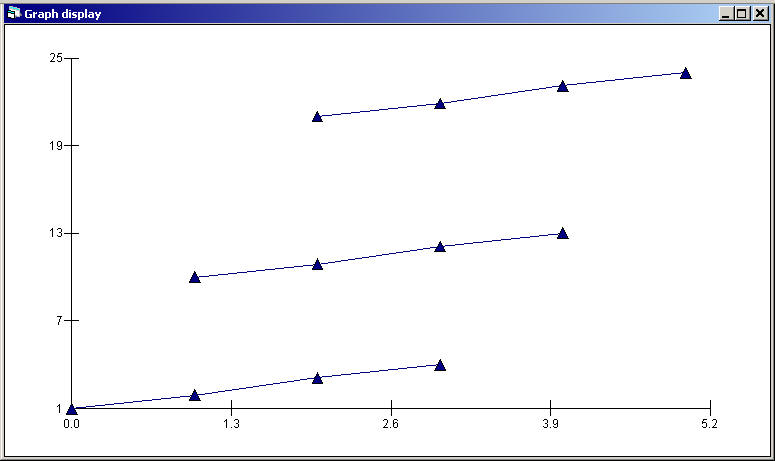
If we average the "iq" and "read" scores across schools (creating 3 scores) and perform a regression predicting "read" from "iq" we would find that the regression predicting "read" from "iq" between the groups has a slope of approximately 10. This represents the between school relationship between "iq" and "read".
Let’s now consider how we might analyze this data using a multilevel model, looking at both the level 1 effect of "iq" (at the student level) and the level 2 effect of "iq" (at the school level). Consider these 3 different ways we could center the predictor "iq" at level 1.
- IQ – No centering (leave "iq" as is)
- IQGrdCen – Center "iq" about the grand mean of IQ (i.e. each students "iq" score minus the grand mean of "iq")
- IQGrpCen – Center "iq" about the group mean (i.e. each students "iq" score minus the mean "iq" for the student’s school)
In addition, we wish to have a "contextual" effect, representing the effect of the average level of "iq" for the school. This could be centered in one of 2 ways.
- MeanIQ – No centering (just take the mean of "iq" for each group)
- MeanIQGrdCen – Center "iq" about the grand mean (like above) and then take the mean of that variable for each group).
This yields a 2 by 3 table showing the different results. B0 represents the intercept, B1 represents the slope for "iq" at level 1, and B2 represents the slope for "iq" at level 2.
| Level 1: IQGrpCen | Level 1: IQGrdCen | Level 1: IQ | |
| Level 2: MeanIQGrdCen | B0=12.167 B1=1.02 B2=10 |
B0=12.167 B1=1.02 B2=8.98 |
B0 = 9.617 B1 = 1.02 B2=8.98 |
| Level 2: MeanIQ | B0 = -12.832 B1 = 1.02 B2 = 9.99 |
B0 = -10.285 B1 = 1.02 B2 = 8.98 |
B0= -12.833 B1= 1.02 B2 = 8.98 |
Notice the following
- In all cases, the slope for "iq" at level 1 is 1.02. This reflects the fact that the slope between "read" and "iq" within schools is 1.
- When "iq" is Group Mean Centered at level 1 (column 1 of the table) the sloped for B2 is 10. When this coding is used, the slope for B2 represents the slope of "iq" and "read" between schools (as if we took the average of "iq" and the average of "iq" across schools and ran the regression using schools as the unit of analysis).
- When "iq" is not Group Mean Centered at level 1 (columns 2 and 3 of the table), the slope for B2 is about 9. This represents the slope between schools minus the slope within schools (i.e. 10 – 1 = 9). This can be used to test whether the the relationship between "iq" and "read" between schools is the same as the relationship between "iq" and "read" within schools.
- The only remaining difference among the techniques lies in the meaning of the intercept. Two of the cells have the most natural interpretation for the intercept, columns 1 and 2 of the first row 1. In both cases, the intercept is 12.167, which reflects the predicted value of "iq" when a student is of average IQ from a school of average IQ.
In summary, the two centering techniques from row 1, columns 1 and 2 yield what appear to be the most interpretable results. In both cases at level 2 IQ is grand mean centered, and then averaged across the schools. Then, if you group mean center IQ and at level 1 then the intercept is the predicted mean reading score for a student of average IQ from a school of average IQ. The slope for B1 is the average increase in "read" you would expect when a students "iq" raises by 1 point, and the slope for B2 is the average increase in "read" you would expect when the schools average IQ increases by 1 point. If instead you grand mean center IQ (row 1, column 2), the interpretation of B0 and B1 is the same, except that B2 is interpreted as the difference in the level 2 slope for "iq" minus the level 1 slope for "iq" (the between school slope for "iq" minus the within school slope for "iq").